R Package for the WoSo Stats project

Took entirely too long, but there is now an R package for the WoSo Stats project!

Go ahead and install it yourself from the WoSo Stats GitHub repo, like so:

devtools::install_github("alfredomartinezjr/wosostats")

This is by no means a finished product. This was admittedly my first, full-fledged, R package, so suggestions and recommendations are welcome. I’ve tried to address the essentials and document the absolutely very essential as much as possible.

Next on the to-do list is going to be to add a bit more documentation for the functions in place, and then a vignette for the package.

Putting this project on hiatus

Hi everyone,

After much reflection, I have decided to put this WoSo Stats project on indefinite hiatus.

There are a few minor things related to ongoing tasks that I will finish in the next few weeks such as adding data for some older matches that are in the middle of being logged. After that, I will no longer be logging any other matches; looking for new volunteers; creating new posts, data, or visualizations; or creating new code to analyze our match data. All the data currently in the WoSo Stats GitHub repository and the WoSo Stats Shiny app will remain available to anyone for free – as it always has been and always will be. In the future if anyone has questions about the data we’ve logged, I will still be reachable at wosostats.team@gmail.com.

This was not an easy decision for me, but it was a necessary one. I had a more free time in the past to dedicate to this project. There was the training and keeping up with volunteers, the developing of the match-logging workflow, the developing of the code for extracting data from the match spreadsheets, the maintenance and updating of documentation on the GitHub repo, the creation of content that went up on this blog and on the Twitter account, and the actual logging of matches. Unfortunately, after trying to convince myself otherwise for the longest time, there is now much less free time in my personal life compared to when I first started this project due to far more pressing and important matters in my life, and it was not going to be enough to focus on even one of those tasks mentioned above. So, instead of doing this half-assedly and dragging my emotional wellbeing down by wondering when I was going to be able to get to the next thing I needed to do for this project, I’m going to let it go and give myself a break.

I’ve been humbled by the innumerable hours of work dozens of volunteers put into this project over the past 2+ years, and I’m incredibly proud of the work we’ve been able to do. We did something no one else had done for women’s soccer, and made it free and publicly accessible. We logged data and managed to extract advanced stats out of, by my count, 151 matches, including the entire NWSL 2016 season. Without the volunteers, none of that would have been possible, and for that I’m an deeply grateful.

I might return to this project some time in the future. Hopefully, in time, the sport will be big enough where this won’t be needed as the only public resource for women’s soccer advanced stats. I started following this sport seven years ago thanks to the 2011 Women’s World Cup (and that’s another story…), and for someone who grew up with soccer it’s been like watching the sport as a little kid all over again. Every year, the sport keeps growing, and my hope is that it’ll one day give back to its players, coaches, staff, fans, and writers much like it has for the men’s game. I hope that, with each passing year, less and less people are getting left out of this beautiful game. I’ll be watching.

-Alfredo

Advanced Passing Stats – USWNT vs. England – SheBelieves Cup 2018

For this summary of passing stats from the USA-England SheBelieves 2018 match, as with past summaries of the USA-Germany match and the USA-France match, and I’m only going to look at open play passes. Open play passes excludes passes from dead ball scenarios – throw-ins, free kick passes, goal kicks, and corner kick passes are all discounted.

I will break down the passing stats by position groups. First, let’s look at the formations the teams used.

The Formations

The United States started the match with a 4-3-3 formation. The centerbacks were Tierna Davidson and Abby Dahlkemper, the fullbacks were Crystal Dunn on the left and Emily Sonnett on the right, the defensive midfielder was Allie Long, the other more attacking-minded center midfielders were Lindsey Horan and Carli Lloyd, the two forward wingers were Megan Rapinoe on the left and Mallory Pugh on the right, and the center forward was Alex Morgan.

Later in the match, after a pair of substitutions in the 74th minute, the formation changed to a 3-4-3. This after an own goal gave the United States the lead. The substitutions were Sofia Huerta, who played as a wingback, and Morgan Brian, who played as a defensive midfielder, for Long and Horan. The result was some shuffling around with the back three being Davidson, Sonnett moving into the center, and Dahlkemper; the two center midfielders being Brian as the defensive midfielder and Lloyd as the attacking midfielder; the wingbacks being Dunn on the left and Huerta on the right, and the front three still being Rapinoe, Morgan, and Pugh.

A couple of minutes later, after Savannah McCaskill was subbed into the game for Rapinoe, the United States took on an even more defensive-minded formation of 5-3-2. The back five still being Dunn, Davidson, Sonnett, Dahlkemper, and Huerta; the three midfielders being McCaskill, Brian, and Lloyd; and the front two being Morgan, Pugh, and later Williams who was subbed on for Pugh very late in the game.

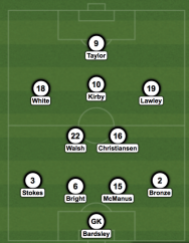
The English started the match with a 4-2-3-1 formation. The centerbacks were Millie Bright and Abbie McManus, the fullbacks were Demi Stokes on the left and Lucy Bronze on the right, the two defensive midfielders were Keira Walsh and Izzy Christiansen, the attacking midfielder was Fran Kirby, the two wingers started off as Ellen White on the left and Melissa Lawley on the right, and the center forward was Jodie Taylor.

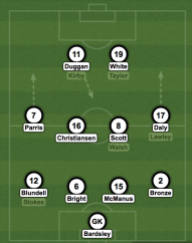
Later in the match, after a pair of substitutions in the 51st minute when Nikita Parris and Toni Duggan replaced Taylor and Duggan, White played as center forward, Parris played as the right winger, and Duggan played as the left winger.

Finally, after Kirby was subbed off in the 74th minute for Rachel Daly, the English changed to a 4-4-2 formation with Daly taking the right wing, Parris moving to the left wing, and Duggan and White playing as the two center forwards. At times it looked like England would go back to a 4-2-3-1 or 4-4-1-1 on the attack when the Duggan would drop into a deeper role.

The Centerbacks

The two U.S. centerbacks saw more of the ball than any other position group, attempting a combined 159 open play pass attempts between Dahlkemper and Davidson, completing 89% and 81%, respectively. The two attempted a high number of launched balls and Dahlkemper had the most success, attempting 18 launched balls from open play and completing 56%, more than Davidson’s 7 attempts for only one completed launched ball. Dahlkemper completed 2/3 through ball attempts from open play and even managed to push up the field high enough to attempt and complete 2 crosses.

The two English centerbacks saw far less of the ball, with McManus attempting 35 open play passes and Bright attempting only 15, each completing 80%. The two passed the ball around between each other (or back to their goalkeeper Karen Bardsley) far less than their American counterparts – 69% of McManus’ and 53% of Bright’s open play pass attempts went forward, compared to 42% for Dahlkemper and 48% for Davidson. So, when McManus or Bright got the ball, they were more likely to drive it forward.

The Fullbacks

The U.S. fullbacks were secure with the ball, with the two with at least 10 open play pass attempts, Sonnett and Dunn, completing 91% and 92%, respectively. No other player in the game with at least 10 attempts had a higher completion percentage. Sonnett’s completion percentage is likely inflated due to the minutes she played as a centerback and the amount of her pass attempts that went backwards – 52%, the second-highest in the game. However, even from her more withdrawn role compared to Dunn, Sonnett was able to complete two through balls from open plays. Dunn didn’t complete a cross or a through ball, but she did have 50% of her pass attempts go forward, tied for third-highest on the team with Lloyd.

The English fullbacks had a lower completion percentage but were far more aggressive with their passes. Bronze and Stokes, the two English fullbacks with at least 10 open play pass attempts, had a lower completion percentage of 68% and 74%, respectively. A higher percentage of those pass attempts went forward, 64% for Bronze and 56% for Stokes, higher than the two U.S. fullbacks and higher than anyone else on their team with at least 10 open play pass attempts except Bardsley and Christiansen at 58%. The two combined for 5 cross attempts but Stokes completed the only one, 9 launched balls of which Bronze completed the only 3, and neither completed their one through ball attempt.

The Center Midfielders

The U.S. midfielders saw Horan with arguably the most contributions to the attack, while Lloyd had less pass attempts and a lower completion percentage. Long had the highest completion percentage of the three, 88%, but 41% of those pass attempts were going backwards compared to 33% for Horan and 20% for Lloyd. Lloyd mostly played as the #10, in a more attacking-minded role compared to Horan who played in more of a #8 role alongside Long. However, Lloyd was unable to even attempt one cross or through ball, while Horan, playing 20 less minutes, completed her 2 cross attempts and 3 out of her 5 through ball attempts.

The English midfielders were a mixed bag, with the defensive midfielders keeping a high completion percentage but their attacking midfielder, Kirby, struggling to pass the ball with a completion percentage of 69%. In the double pivot of Christiansen and Walsh, Christiansen was the more attacking-minded with 58% of her open play pass attempts going forward compared to Walsh’s 38%. Christiansen also completed 3/7 launched ball attempts, 1/3 cross attempts, and 1/5 through ball attempts.

The Forwards & Wingers

Out of the U.S. forwards, Rapinoe was the most aggressive with only 14% of her open play pass attempts going forward, the lowest of anyone on the field except for England’s Bright, compared to 44% for Pugh and 37% for Morgan. She had the lowest completion percentage of the three, completing 61% of her open play pass attempts compared to 70% for Pugh and 68% for Morgan, but she was the only U.S. forward to complete a cross (out of a game-high 9 attempts) and she was the only one to complete a through ball (out of two attempts).

The English forwards and wingers saw the ball far less and saw a variety of completion percentages, with Duggan completing 82% of her 11 open play pass attempts, Lawley completing 75% of her 12, and White completing 58% of her 12. White had a higher percentage of her open play pass attempts going forward, 50%, than any other forwards or wingers in the game.

Screen Shot 2018-03-11 at 10.33.50 PMScreen Shot 2018-03-11 at 10.35.08 PM

Advanced Passing Stats – USWNT vs. France – SheBelieves Cup 2018

Similar to the last post I wrote for the USA-GER match, we’re going to look at passing stats for the latest USA-FRA SheBelieves match, with an added look at specific types of passes such as launched and through balls. Like last time, we’ll only look at open play passes – which excludes throw-ins, free kick passes, goal kicks, and corner kick passes.

Formations

The United States started out with a 3-4-3 on offense that turned into a 4-3-3 on defense. In the 3-4-3; the back three was Tierna Davidson, Andi Sullivan, and Abby Dahlkemper; the wingbacks were Kelley O’Hara on the left, Abby Smith on the right, and Casey Short on the right after Smith was subbed out; the center midfielders were Morgan Brian, Lindsey Horan, and Savannah McCaskill after Horan was subbed out, and the front three forwards were Mallory Pugh, Alex Morgan, Megan Rapinoe, and Lynn Williams after Rapinoe was subbed out. On defense, the 3-4-3 would turn into a 4-3-3 with the wingbacks dropping back to defend and Sullivan moving up the midfield in front of the backline. In that 4-3-3, Crystal Dunn played as a fullback and Christen Press played as a forward winger

Later in the game, sometime after the 72nd minute after Sullivan was subbed out and an injury to Short, the 3-4-3 stuck to a 4-3-3 for the rest of the game. On attack the fullbacks would continue to move up, but no center midfielder dropped back to form a back three.

FRAvUSA-030418


The French formation was a 4-4-2 throughout the match that at times turned into a 4-2-3-1 when on the attack. The centerbacks were Aissatou Tounkara and Mbock Bathy, the fullbacks were Amel Majri on the left and Marion Torrent on the right, the center midfielders were Amandine Henry and Onema Geyoro, the wingers were Eugenie Le Sommer on the left and Viviane Asseyi on the right, and the forwards were Gaetane Thiney and Valerie Gauvin. Gauvin was later replaced by Kadidiatou Diani. Thiney was the more withdrawn of the two forwards, often dropping back deeper to receive the ball.

I will go over the passing stats for each group. Scroll to the bottom to see the complete table.

The Centerbacks

In the U.S. backline, Sullivan’s role was largely spent passing sideways – 56.7% of all her open play pass attempts went sideways, the highest of anyone on the field with at least 10 open play pass attempts. Dahlkemper and Davidson were more forward-minded, with 56.7% and 51.9% of their open play pass attempts going forward, respectively. For the French centerbacks, Tounkara and Mbock’s breakdown of open play pass attempts by direction were similarly more forward-minded, with 53.6% and 63.0% of their open play pass attempts going forward, respectively.

There was a great difference in passes attempted, with the three U.S. centerbacks combining for 181 open play pass attempts, compared to 55 for Tounkara and Mbock, showing just how much time the ball spent going through the U.S. backline during the game.

There was also a great difference in the types of passes attempted. The U.S. centerbacks combined for 23 launched balls and 4 through balls out of open play. No other position group, U.S. or French, got even close to attempting as many launched balls. Dahlkemper even drove forward far enough to attempt a cross. The French centerbacks, however, even with less launched balls and only one through ball attempt, were the ones to get goal out of their efforts – Mbock’s through ball to Le Sommer in the 38th minute led to the score that drew the match for France and registered as a key assist.

The Fullbacks

The U.S. fullbacks were a mixed bag, with O’Hara finishing the match but three different players playing on the other side of the field. O’Hara’s was the more involved, attempting 34 open play passes while the other three combined for 25. O’Hara’s 73.5% completion percentage was the highest of any of the fullbacks with at least 10 pass attempts. The entire group of U.S. fullbacks in open play only amounted to 3 launched ball attempts of which one was completed by Short, 0 through ball attempts, and 3 cross attempts that were all incomplete. Short appeared to have been on her way to an offensive-minded day with 5 of her 8 open play passing attempts going forward until she got injured.

The French fullbacks, meanwhile, were much more present on offense. The two combined for 60 open play pass attempts, one short of the U.S. fullbacks’ 59, but appeared to attempt more on the attack – 63.6% of Majri’s open play pass attempts went forward while it was 74.1% for Torrent – even if their success rate wasn’t as high. Majri competed only 54.5% of her open play pass attempts, while Torrent completed 66.7%. Majri was 1/6 on launched balls, 1/2 on through balls, and 1/5 on crosses. Torrent was 2/6 on launched balls, 0/2 on through balls, and 1/2 on crosses.

The Center Midfielders

The U.S. center midfielders were a similarly mixed bag, and possibly a story of what could have been had McCaskill played for the full 95 minutes. Brian attempted 26 open play passes, the most of any U.S. midfielder, and had a completion percentage of 73.1%, higher than any other U.S. player with at least 10 pass attempts who wasn’t a defender. But McCaskill attempted 20 in just 49 minutes which was on pace for 38.7 passes (let’s say we round it up to 39) in 95 minutes. The biggest knock against McCaskill’s passing numbers is her 65% completion percentage, the third lowest in the game for a U.S. player, likely explained by 65% of her passes going forward, second in the entire game only to Torrent if you exclude the goalkeepers. Horan, who played the entire first half, and Lloyd, who played the last 22 minutes, simply didn’t get off enough open play pass attempts. Between the entire group, they were 1/4 on launched balls and 1/1 on through balls thanks to McCaskill.

The French center midfielders were more involved. Henry attempted 36 open play pass attempts with a completion percentage of 80.6%, while Geyoro attempted 24 passes with a completion percentage of 70.8%. They combined for 5/11 on launched balls and 2/8 on through balls thanks to Henry’s two through ball completions.

The Wingers

The U.S. wingers had the lone goal for their team – a goal by Pugh coming off a chaotic set piece. In the open play, they had a tougher time driving the ball forward. Pugh attempted the most passes, 20, but had a 55% completion percentage, the fourth lowest in the entire game of anyone with at least 10 pass attempts. Williams, who played the entire second half, attempted 13 passes but completed 46.2% of her pass attempts, the lowest in the game. Rapinoe, meanwhile, attempted 10 open play passes and completed 7 of them, but only played the first half. Not a single of the U.S. forward wingers completed a through ball and Press, who only played 18 minutes and attempted 5 open play passes, had the only two completed crosses.

Meanwhile, Le Sommer attempted 30 open play passes and completed 80% of them, higher than any other midfielder in the game with at least 10 pass attempts. Asseyi had less pass attempts, 18, and a lower completion percentage, 72.2%. They each completed one through ball, and Asseyi completed one cross.

The Forwards

Morgan had 17 open play pass attempts, a 70.6% completion percentage, and 52.9% of her pass attempts went forward. That was a higher completion percentage and higher percentage of passes going forward than any of the other U.S. forward wingers. Morgan was 0/1 on launched balls and 1/2 on through balls.

Thiney, meanwhile, had more pass attempts, 29, a lower completion percentage, but appears to have been far more aggressive in driving the ball forward from her withdrawn role. She was 1/2 for launched balls, 3/6 on through balls, and 0/2 on cross attempts. Gauvin, meanwhile, often the lone striker at the top of the French formation, attempted 16 open play passes and racked up a higher completion percentage than Morgan or Thiney, 81.3%, but more of her pass attempts, 43.8%, were going backwards, likely to pass on the ball onto an teammate running towards the goal.

Screen Shot 2018-03-06 at 8.05.33 PMScreen Shot 2018-03-06 at 8.06.51 PM

Advanced Passing Stats: USWNT vs. Germany – SheBelieves Cup 2018

For this summary of passing stats from the USA-Germany SheBelieves 2018 match, I’m only going to look at open play passes. Open play passes excludes passes from dead ball scenarios – throw-ins, free kick passes, goal kicks, and corner kick passes are all discounted.

FormationsUSA-433

The United States lined up in a 4-3-3, with O’Hara and Smith as the fullbacks; Davidson and Dahlkemper as the centerbacks; Ertz as the defensive midfielder; Horan and Lloyd as the two other center midfielders, Rapinoe as the left forward, Morgan as the center forward, and Pugh as the right forward.

Germany lined up in a 4-2-3-1, with Faisst and Maier as the fullbacks; Peter and Hendrich as the centerbacks; a midfield trio of Kemme, Dabritz, and Marozsan; Dallmann as the left winger, Popp as the center forward, and Huth as the right winger.

GER-4231

Germany’s midfield, and even Popp’s role, was fluid throughout the match, with Kemme’s role being the most solidified as a defensive midfielder for most of the game (until she played as a fullback later in the match). Dabritz and Marozsan would often switch roles, with Popp dropping deep several times.

The Centerbacks

The two USA centerbacks – Davidson and Dahlkemper – had very high open play passing completion percentages and a high number of open play passes attempted. Davidson finished with the highest open play passing completion percentage of the game (minimum 10 passes) at 92.6%. Dahlkemper had a lower open play passing completion percentage, 82.4%, but she also had more open play passes under pressure – 17.6% compared to 7.4% for Davidson. Whether or not that was due to passes to Dahlkemper already going to her while under pressure, or whether German players got to apply pressure to her before she managed to get off a pass attempt requires further analysis. Sonnett, in her 10 minutes on the field, did not register an open play pass attempt.

The three German centerbacks – Hendrich, Peter, and Goessling  – each had high passing completion percentages and a higher percentage of their passes going forward. Hendrich, Peter, and Goessling’s open play pass attempts went forward 64.4%, 53.6%, and 73.7% of the time, respectively, compared to Dahlkemper’s 58.8% and Davidson’s 44.4%. They each were also under pressure much more often.

Screen Shot 2018-03-04 at 6.52.02 AM

Open play passing stats for USA & GER centerbacks

The Fullbacks

Taylor Smith – matched up on the right wing against Germany’s Dallmann and Faisst – found her open play pass attempts under pressure more often than O’Hara, 68.4% of the time compared to 35.7%. O’Hara – matched up on the left against Germany’s Huth and Maier – had a higher passing completion percentage of 78.6% compared to Smith’s 73.7%. The two combined for 3 open play cross attempts that were not completed. Short only registered 5 open play pass attempts in her 16 minutes on the field.

As for the Germans, the starting fullbacks were Faisst and Maier, with Kemme playing as a rightback late in the match. However, due to being unable (for now) to split up Kemme-as-a-midfielder stats from Kemme-as-a-fullback’s stats, I’ll treat her as a midfielder later on. Compared to their American counterparts, Faisst and Maier were more involved in the German passing game, with 37.5 and 37.4 open play passes attempted per 90 minutes, respectively, compared to O’Hara’s 31.5 and Smith’s 17.8. Their completion percentages were all lower, though, with Faisst completing 72.5% of her open play passes and Maier completing the lowest of the fullbacks, at 65.6%. The two combined for 4 open play cross attempts, which, just like O’Hara’s and Smith’s, and likely thanks to the strong winds that night, went nowhere.

Screen Shot 2018-03-04 at 7.06.13 AM.png

Open play passing stats for USA & GER fullbacks

The Midfielders

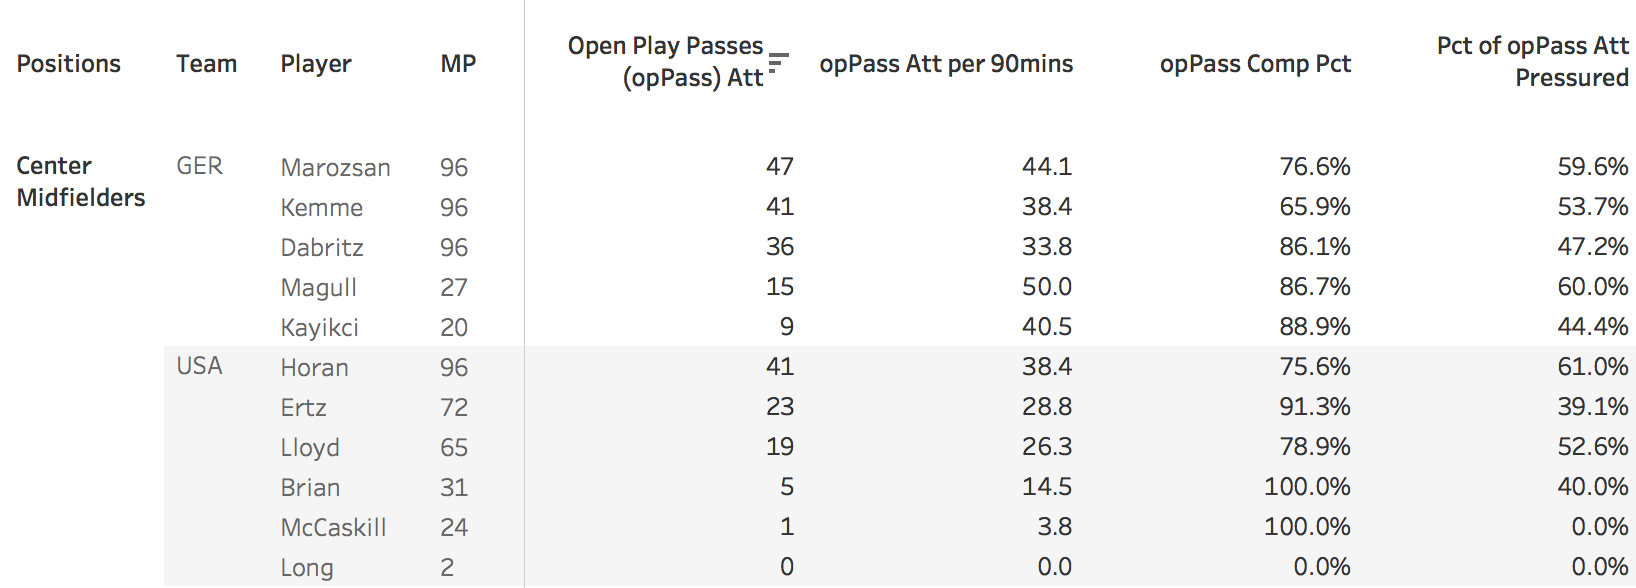
Ertz’s passing game was stellar in the midfield, with 28.8 open play passes attempted per 90 minutes and a 91.3% completion percentage – the second-highest in the game. The two other USA midfielders with significant open play passing numbers (at least 10 attempts), Horan and Lloyd, had lower passing completion percentages (75.6% and 78.9%, respectively), but were also under pressure far more than Ertz (61.0% and 52.6% of all open play pass attempts, respectively, compared to Ertz’s 39.1%) due to their higher position up the field.

For the Germans, Dabritz and Magull stood out for their high open play passing completion percentages, 86.1% and 86.7% respectively. Magull only played for 27 minutes but finished with the 50.0 open play passes attempted per 90 mins, the highest in the game. Marozsan was the most involved in Germany’s passing game throughout the entire game, with the most open play passes attempted, 47, out of anyone on the field, although she finished with a completion percentage of only 76.6%. Kemme, meanwhile, struggled with an open play passing completion percentage of only 65.9%.

Screen Shot 2018-03-04 at 7.33.18 AM.png

Open play passing stats for USA & GER midfielders

 The Wingers & Forwards

I considered Rapinoe and Pugh more as forward wingers, and Huth and Dallmann more as midfield wingers in a slightly deeper role, but I figured it would be worthwhile combining the two roles together in this part, including Alex Morgan, too, who primarily was a center forward for the entire match.

Out of all the wingers, Rapinoe’s open play pass attempts were under the most pressure, at 68.2%, compared to everyone else who was between 62% and 64%. Her passing game, matched up against Maier, struggled even more, completing only 58.3% of her open play pass attempts, compared to Pugh on the other side who completed 88.0%. Both Rapinoe and Pugh attempted a similar number of open play passes per 90 mins (23.0 and 24.7) and a similar number of crosses completed/attempted (1/2).

Huth’s passing game similarly struggled like Rapinoe’s, completing only 58.3% of her open play pass attempts, compared to Dallmann’s 72.4%. Dallmann had a slightly higher number of open play passes attempted per 90 mins, at 37.8 compared to Huth’s 33.8. The large differences in completion percentages can partially be explained by Huth’s persistent yet ineffective crossing game, completing only 1 cross attempt out of 7, compared to Dallmann’s 1 cross completion out of only 2.

Finally, the two forwards, Morgan and Popp, who had the highest percentage of open play pass attempts under pressure out of anyone in the game, at 79.3% and 76.3%, respectively. Popp attempted more passes, 38, compared to Morgan’s 29, and finished with a significantly higher completion percentage of 76.3% compared to 69.0%. Popp, however, was not as fixed in her role as the center forward as Morgan was, dropping back into her half several times to help defend and receive the ball. Morgan’s more constant presence higher up the field might be reflected in her percentage of pass attempts that went backwards – 41.4%, the second-highest in the game to Dabritz – suggesting numerous instances where she was holding up the ball and dropping it back for a teammate facing the German goal.

Screen Shot 2018-03-04 at 7.37.20 AM

Open play passing stats for USA & GER wingers and forwards


Help us log USWNT matches for the 2018 SheBelieves Cup

Hi everyone,

As part of our project to log data for women’s soccer matches, we plan to track data for the USWNT 2018 SheBelieves matches and we could use some help.

The schedule is below – match replays will likely be available no later than 24 hours after each match’s conclusion. Non-USWNT matches are listed in case we get enough help to cover the USWNT matches and if there’s enough interest in logging those other matches.

  • Thursday, March 1, 7pm ET – United States vs. Germany
  • Sunday, March 4, 12pm ET – United States vs. France
  • Wednesday, March 7, 7pm ET – United States vs. England
  • Thursday, March 1, 4pm ET – England vs. France
  • Sunday, March 4, 3pm ET – Germany vs. England
  • Wednesday, March 7, 4pm ET – France vs. Germany

To learn how to log matches, get started here: https://wosostats.wordpress.com/how-to-help. It’s highly recommended to start out with logging match actions, as location data can’t be logged unless match actions are already logged. You’ll likely be asked to use a past USWNT match as a test run – logging it for no more than 10 match minutes or 2 hours of your time, whichever comes first – to get an idea of how you do before you’re asked to log an entire match’s half.

If you’re interested, email me (Alfredo) at wosostats.team@gmail.com. Thanks!

USWNT passing – comparing positions and opponents’ FIFA rankings

Over the past couple of days I’ve been trying to figure out how to create a Tableau workbook that aggregates all our USWNT data in a similar fashion to the NWSL 2016 Tableau workbook. The main challenge has been figuring out how to best show and compare stats from USWNT that, quite frankly, are all over the place due to how varied the quality of opponents has been.

Thankfully, we’re able to use all the USWNT stats tables we’ve got in the GitHub repo and use the database.csv file, with data for all the matches in the WoSo Stats GitHub repo, to create something that can show something like passing stats adjusted for the opponent’s quality.

The visualizations for the USWNT data, for now, are the two worksheets in this Tableau workbook. Below, I’ll explain what each one is, and some more detail on how how the data was calculated and aggregated to make it easier for you to make similar visualizations.

I won’t delve too much into an actual analysis of the data in the two charts. There’s too much there to go into right now – and why have all the fun when you can do that, too? Anyways, on to the charts

Visualizing USWNT Open Play Passing Stats

First, this visualization of USWNT passing stats for the USWNT matches that we have in our database. Each mark on the chart below represents a USWNT player from a match in our database. The x-axis is her total number of open play passes attempted during that match, the y-axis is her open play passing completion percentage. The color is her designated “position” (more on this later) and the shape of the mark is whether or not the opponent, at the time, had a FIFA ranking in the top 15.

Screen Shot 2017-07-16 at 9.27.38 AM


Midfielders and defenders generally pass the ball more, which is to be expected. Forwards, who are often surrounded by defenders, and goalkeepers, who may often launch the ball forward, see less of the ball and have lower passing completion percentages. It’s pretty clear that differences in passes attempted and in passing completion percentage have to do with the nature of a player’s position. We need to better adjust for position.

Adjusting For A Player’s Position

This visualization shows passing stats adjusted for a USWNT player’s position by using her standard deviation from the average for USWNT players in her position.

Screen Shot 2017-07-16 at 9.52.13 AM.png

Now it’s easier to spot which players, given their “designated” position, attempted to pass the ball more than average and completed their passes at a higher percentage than average. On the other hand, it’s also easier to spot which players passed the ball less than average and completed their passes at a lower percentage than average.

To account for some outliers, in the chart below I used the filters to exclude performances from any USWNT players who played less than 30 minutes and any USWNT players who had less than 10 open play pass attempts.

Screen Shot 2017-07-16 at 10.06.09 AM.png

A few things stand out. One, it’s easier to rack up more passing attempts with a high passing completion percentage against lesser opponents, as indicated by how many more cross-shaped marks compared to circle-shaped marks are in the upper-right. And playing top opposition can drastically cut down on both, with several circle-shaped marks spread out throughout the bottom-left corner.

Players’ “Designated” Positions and Next Steps

About the positions. Players are only given one for all their matches, instead of one for each match. This means that a player like Allie Long who in this chart is classified as a “midfielder” is being misrepresented for games where she has played as a defender.

And even within positions, some further refinement could be used. Fullbacks like Kelley O’Hara and Ali Krieger, who are correctly classified as “defenders,” have a propensity towards lower passing completion percentages because, as fullbacks, they often play higher up the pitch where a completed pass is less likely. But because they’re defenders, their passing completion percentage’s standard deviation from the average for all defenders looks worse than it really is because they’re counted against centerbacks, who are also correctly called “defenders” but have some of the highest completion percentages in the game.

A next step is going to be to figure out a way to resolve that Allie Long problem and figure out, on a match-by-match basis, a player’s position for a given match. And then further breaking down some positions like defenders into fullbacks and centerbacks.

Another idea is to only show passing stats broken down by thirds of the fields. I suspect the difference in passing stats vs Top 15 opponents and non-Top 15 opponents would be even more stark when we look at the attacking third.

You can help!

This data only happens because of help from fans like you (yes, you)! The WoSo Stats project needs help to log more stats and location data for USWNT stats, and past NWSL seasons. With your help, we can get even more richer data to expand on what we know about the sport.

If you’re interested in logging data for matches (that are all publicly available on YouTube), read more here and email me at wosostats.team@gmail.com or send me a DM at @WoSoStats on Twitter. All the data logged will be publicly available on the WoSo Stats Github repo and will help me and others do more analyses like these!

Passing networks for the Seattle Reign’s 2016 season

Following up on the previous post that delved into the passing network for the Portland Thorns’ 2016 season, now it’s time for the Seattle Reign. Same approach as last time, and the Seattle Reign’s passing networks as an Excel workbook can be downloaded here from the WoSo Stats GitHub repo.

I’ll also look at how the numbers compare to the Portland Thorns’ passing network, although as I write more of these for every team it’s going to be harder to keep these comparisons within the scope of one blog post.

First things first, the first sheet in the Excel workbook, and explanations again for what we’re looking at.

srfc-passnetwork-sheet1

The rows are players passing the ball and the columns are players receiving a completed pass. The cell in the bottom-left area where the “Yanez” coumn meets the “Barnes” column, then, is the total number of passes that Yanez completed to Barnes throughout the 2016 NWSL season.

Each cell only represents completed passes. This is extremely important, because we’re missing out on data about how many times a player was actually targeted by another teammate. This data is missing because, well, it can get extremely hard, if not outright impossible, to determine both from looking at the match spreadsheet and even during a match where a missed/blocked/cleared/intercepted pass was supposed to go. Maybe in the future we, or someone else, can go back through all these matches or future matches and figure out how to do that, but for now we’re going to have to go without that. But at the very least understand that these passing numbers only represent completed passes

The darker the green, the higher the value of the cell. The whiter the cell, the closer it is to zero.

These are raw numbers for the entire season, and they don’t take into account how many minutes each player combo was actually on the field. The table below does, with each cell now representing passes completed per 90 minutes on the field that player combo was on the field.

srfc-passnetwork-sheet2

As was done with the previous post, I hid the columns for players who never were on the field with any teammates for 270 or more minutes to exclude any extremely high passing per 90 numbers that may show up merely because a few passes were exchanged during very limited minutes.

Despite that, there are two player relationships with extremely higher completed passes per 90 than anyone else – Reed-to-Kawasumi (17.1) and Solo-to-Corsie (13.0) Outside of those two, there’s a concentration of passing relationship with relatively high numbers in the upper left portion of the spreadsheet, with a few more darkly-shaded cells further down the defender columns and defender rows.

Compared to the Portland Thorn’s per 90 passing network, where that upper-left region of the spreadsheet is lighter, a greater proportion of Seattle’s completed passes were coming from defenders or going to defenders. That doesn’t necessarily mean that Seattle’s midfielders or forwards were doing less. If you look at the raw numbers in the area for midfielders-to-midfielders and midfielders-to-forwards, it actually looks like Seattle had more completed passes per 90 going on – there was just even more passing going on in the back.

Below is the same spreadsheet, but with each row (each passer’s recipient) highlighted individually.

srfc-passnetwork-sheet3

This table makes more sense if you look at the columns and look for players with a high number of very dark cells, indicating that they’re a top completed passing target for several players.

With that in mind, Barnes and Fishlock stand out. Barnes was the #1 or #2 target for the most completed passes per 90 for six different players – Kopmeyer, Fletcher, Pickett, Fishlock, Utsugi, and Winters. Fishlock was the #1 and #2 for four different players – Barnes, Corsie, Little, and Solaun.

As for the forwards, the two biggest targets appear to have been Kawasumi and Yanez, with a relatively high number of passes per 90 going her way from the midfield, other forwards, and the defense.

Below, the highlighting is flipped around and each column’s highest values are highlighted.

srfc-passnetwork-sheet4

Now, look at which rows have a higher number of darker cells, indicating that they’re a top origin for completed passes per 90 for several players.

Defenders stand out as a top origin for completed passes, as opposed to the Thorns’ passing network where those columns were a lighter shade. The Reign in general appear to have some pretty extreme differences throughout this spreadsheet, with players like Utsugi, Fishlock, and Kawasumi passing to certain teammates way more than anyone else.

Passing networks for the Portland Thorns’ 2016 season

We have all 21 of the Portland Thorns’ 2016 matches logged in match spreadsheets like these, which when they’ve got location data I’ve combed through for some valuable location data. I wanted to see how much more passing data I could get out of these match spreadsheets, even without any location data, which only a few of our matches have. Below is a quick look at the numbers for a sort of “passing network”, but without the graphics and lines and instead with just tables and some useful formatting.

The R code I created to generate a table of shared passes and a table of shared minutes is here on the WoSo Stats GitHub repo. There are comments in the code that are hopefully enough to explain how it works but I’ll delve into that in greater detail in a future blog post. For now, let’s at that data for the Portland Thorns to get a better look at how the ball was being passed around.

The Excel spreadsheet shown below, based on tables you can create from the R code mentioned above, can be downloaded here from the WoSo Stats GitHub repo (click on the “Download” button).

I’m just going to briefly go over what we see when use some Excel formulas and conditional formatting, and what it can quickly tell us about how the Thorns were passing around the ball.

Screen Shot 2017-05-08 at 9.04.07 PM

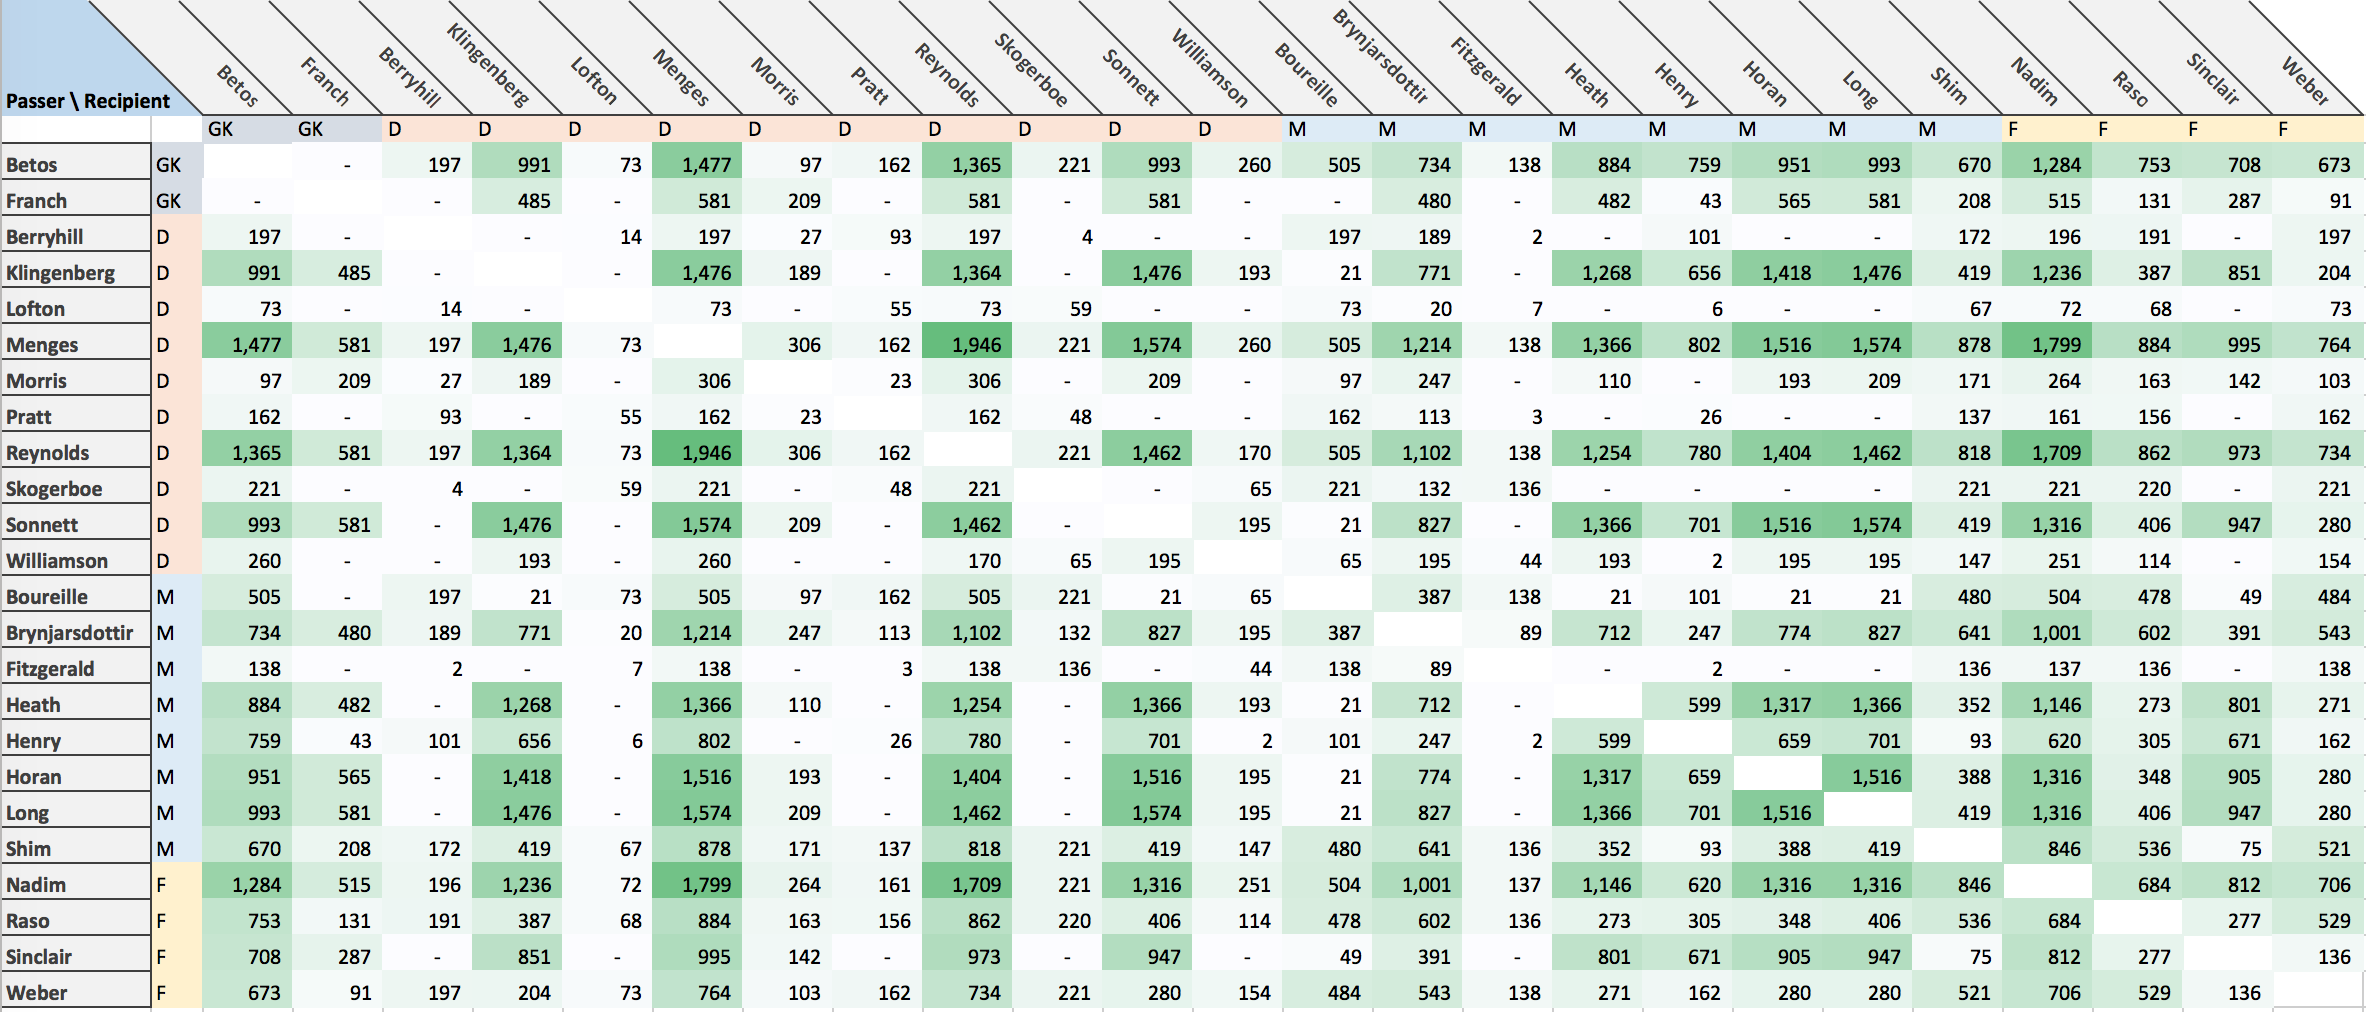
Here’s the first sheet of the Excel workbook, and there’s a few important things to understand that will be true for the following sheets as well.

First of all, the rows are the players passing the ball, and the columns are the players receiving a completed pass. So, let’s look at the bottom-left cell.”Weber” is the row, so she’s the player passing the ball, and “Betos” is the column, so she’s the player receiving the pass; therefore, that cell represents the number of passes that Weber completed to Betos during the entire 2016 season. So, just one.

Second, each cell only represents completed passes. This is extremely important, because we’re missing out on data about how many times a player was actually targeted by another teammate. This data is missing because, well, it can get extremely hard, if not outright impossible, to determine both from looking at the match spreadsheet and even during a match where a missed/blocked/cleared/intercepted pass was supposed to go. Maybe in the future we, or someone else, can go back through all these matches or future matches and figure out how to do that, but for now we’re going to have to go without that. But at the very least understand that these passing numbers only represent completed passes. So, remember that value of 1 that was where the “Weber” row meets the “Betos” column? For all we know, maybe Weber tried passing the ball back to Betos another 10 times and they were missed (probably not, because forwards usually aren’t passing the ball back to their goalie that much, but you get the idea).

Finally, the darker the green, the higher the value of the cell, just in case it isn’t obvious. The whiter the cell, the closer to zero it is. The darker the cell, the closer to the highest value it is.

Okay, now that we’ve got all that out of the way, what’s going on here? There are some extremely dark pockets in this spreadsheet, but they’re not taking into account the fact that some players were on the field together way more than other pairings. Take Amandine Henry, for example – finished the season with 48.4 passes attempted per 90 minutes and 38.3 passes completed per 90 minutes, but her row and column of shared passes is way lighter than other Thorns players simply because they played more minutes and had more time to pass to each other.

We need another table that has the number of minutes a player shared with each teammate, which is below. Writing up the code to generate this was a pain in the ass, so please admire it just for a few seconds.

Screen Shot 2017-05-08 at 9.14.44 PM

This table is diagonally symmetric and, for the purposes of this analysis, will mainly be used to calculate the per 90 passing numbers below.

Screen Shot 2017-05-08 at 9.23.35 PM.png

You may have noticed the following players are missing: Berryhill, Lofton, Pratt, Skogerboe, Williamson, and Fitzgerald. This is because for this spreadsheet I hid the columns for players who never were on the field with any teammates for 270 or more minutes. This is to exclude any extremely high passing per 90 numbers that may show up merely because a few passes were exchanged during very limited minutes.

So, now we’re looking at the, for lack of a better term, the “passes completed by the row player to the column player per 90 minutes.” Remember that “Weber to Betos” cell we were looking at, the one in the bottom left? Now it reads as 0.13 passes completed by Weber to Betos every 90 minutes.

I also added each players overall passing completion percentages for the season at the end of each row and column, and the black lines are meant to block out different position players. Finally, the grey boxes are values that had less than 270 minutes. For example, look back to Weber – she was on the field with Betos for at least 270 minutes, so that 0.13 value appears, but she was only on the field with Franch for 91 minutes, so that cell value gets greyed out.

There’s a lot to dig into here, but one thing I like looking at is how defenders move the ball to the midfielders, how midfielders move the ball to the forwards, and how the goalkeepers and defenders try to get straight to the forwards. By looking at the defender rows, it looks like Klingenberg-to-Heath and Klingenberg-to-Horan are by far the most fruitful midfielder-to-defender passing relationships. The only other defender-to-midfielder to relationship that happens as much is Sonnett-to-Henry, and keep in mind Henry only played half the season.

In the midfielder rows, where they meet the forward columns, there’s less darker colors because it’s just harder to pass the ball to the forwards, so that section of the table is just naturally going to be a lighter shade most of the time. One stat that stands out to me is how the high number of passes Shim completed to Raso, 5.08, higher than any other midfielder-to-forward combo, especially considering they were only on the field together for 536 minutes.

Now, let’s look at this table with the highlighting done a little differently. Below is the same numbers as above, but with each row highlighted individually.

Screen Shot 2017-05-08 at 9.43.30 PM.png

Look at the Betos row, for starters. The higher value in that row is the 7.19 completed passes to Menges, so that’s going to be the darkest cell in the row. Meanwhile, the lowest value of 0.13 completed passes to Weber is the lowest, whitest cell. A few rows down, Sonnet’s highest value of 5.62 completed passes to Betos is the darkest cell, while her 0.85 completed passes to Heath is the lowest.

This table will probably make most sense if you look at the columns and look for which players have a high number of very dark cells. Menges appears to have been a very frequent passing target for almost every defender. Heath and Henry had a relatively high number of completed passes from defender, midfielders, and forwards. Nadim had a high number of completed passes from midfielders and other forwards, and Sinclair looks like she was deeper down the field and had a relatively high number of completed passes from midfielders and defenders.

Finally, let’s look at this highlighted flipped around. Now, each column’s highest values are highlighted.

Screen Shot 2017-05-08 at 9.58.20 PM.png

Take a quick look at the rows and see which players were more likely to be the origin of a completed pass. Klingenberg, across the board from goalkeepers all the way up to forwards, appears to have been the origin of a relatively high number of completed passes for many teammates. Farther down the table, Allie Long and Amandine Henry were the origin for a great deal of completed passes for several defenders, midfielders and forwards.

There’s more to dig into here, and especially when we compare these raw numbers to another team’s passing network. There are three other ones I’ve created for the Seattle Reign, Western New York Flash, and the Houston Dash that can be found here on the WoSo Stats GitHub repo. In a later blog posts, I’ll look compare these to each other to see just how wildly different a team can pass the ball around. For now, I hope you’ve enjoyed seeing the rich data we can glean into passing relationships from the data we’ve got.

Morgan Brian and Sarah Killion: Using stats to differentiate midfielders

Two weeks ago, I touched a bit on open play passing stats for Ali Krieger by breaking down attempts and completion percentage by thirds of the field. Since then, I challenged myself to see how much I could dig into passing stats to try to find some differences between two players who on the face of it look very similar – Morgan Brian and Sarah Killion. They’ve both played primarily as defensive midfielders, they both pass the ball a similar amount of times, and they have almost the same passing completion percentage.

The following data is also only for 40 out of 103 NWSL 2016 matches that we’ve logged with complete location data. To see the list of matches this data represents, see the database in the WoSo Stats Github and look for all the matches with “yes” in the “location.complete” column.

As you read through the post below, please consider that this data is only possible to hard work from fans like you who have been logging matches over the past year. The WoSo Stats project needs your help to log more stats and location data for the NWSL 2016 season, for USWNT matches, and beyond. The more data we get, the better we’ll be able understand the sport. If you’re interested in logging data for matches , read more here and email me at wosostats.team@gmail.com or send me a DM at @WoSoStats on Twitter. All the data logged with be publicly available on the WoSo Stats Github repo.

Getting the passing stats

If you’re not interested in the coding aspect of this or how to get this data yourself, feel free to skip ahead to the next section. All the data used is available to download from this Tableau visualization.

The instructions for how to use the creating-stats.R file are here in the WoSo Stats Github repo. If you’re familiar with R, first things first, source this R file and then run the getStatsInBulk function with the arguments shown below:

your_stats_list <- getStatsInBulk(competition.slug = “nwsl-2016”,location = “thirds”,location_complete=TRUE,section=”passing”)

This will take about a minute. Then run the mergeMatchList function with the following arguments to get the stats table as a data frame named “your_stats”:

your_stats <- mergeStatsList(stats_list = your_stats_list,add_per90 = TRUE,location = “thirds”,section=”passing”)

In there are columns for open play passes, which in the columns are called “opPass.” Open play passes are defined as all passes that aren’t one of the following – namely, dead ball plays:

  • Throw-ins
  • Corner kicks
  • Goal kicks
  • Free kicks
  • Drop kicks or throws by the goalkeeper

A change from previous posts is the “section” argument. Instead of creating a massive stat table with all sorts of stats you may not be interested in, you can now just create a stats table for a specific type of stats (attacking, passing, possession, defense, goalkeeping). For this analysis, we’ll only need to look at passing stats, so we can just assign “passing” to the section argument.

The “your_stats” data frame is the stats table that is behind the Tableau visualization that has all the charts shown below. The Tableau viz was created with Tableau Public, and you should be able to download it yourself. For now, let’s have a look at the data.

Overall Passing Stats

For starters, let’s look at how Brian and Killion look if we just look at two very basic stats – open play passes attempted per 90 and open play passing completion percentage, sorted by total open play passes attempted per 90.

Screen Shot 2017-03-12 at 4.15.54 PM

Both Brian and Killion have nearly the same stats. Brian has 52.1 open play passes attempted per 90 minutes with an 82.3% passing completion percentage. Killion has 53.3 open play passes attempted per 90 minutes with an 84.7% passing completion percentage.

There’s a lot that could be happening deeper underneath those stats, so let’s look at that bar chart, broken down by open play passes attempted per 90 for each third of the field (defensive, middle, and attacking). Here, we begin to see some differences in where Brian and Killion’s passes are happening, and some big similarities as well compared to the players around them.

Screen Shot 2017-03-12 at 4.03.00 PM.png

Killion, per 90 minutes, attempts a couple more open play passes in the middle 3rd. Brian, meanwhile, per 90 minutes, has a few more open play passes in the attacking 3rd. Brian seems slightly more attacking-minded and Killion attempts more of her passes out of the midfield. Killion, quite simply, with the matches we have that have location data logged data, attempts more open play passes out of the middle 3rd of the field, per 90 minutes, than anyone else in the league.

Compared to almost every other played visible here, they pass the ball in open play out of the middle 3rd more times than anyone else except for Barnes, who is only ahead of Brian. They both have a very high percentage of their passes coming out of the midfield.

Now, what about the passing percentages? Below is a chart stacking, for each player, their open play passing completion percentages in each third of the field. Almost everyone’s passing completion percentage drops as they get closer to the opponent’s goal, so here relative differences are what’s interesting to look at.

Screen Shot 2017-03-12 at 4.37.37 PM

Recall that Killion had more open play passes attempted out of the middle 3rd. Now we can see that she also has a significantly higher passing completion out of the middle 3rd, 85.7%, than Brian – and almost everyone else in this list of top-16 most open play passes attempted per 90, except for Little, who has an astonishing 90.1%, and Fletcher, with whom she’s tied.

Brian, on the other hand, has a significantly higher passing completion percentage out of the attacking 3rd, 77.5% and nearly 12 points higher than Killion – and also tied with Buczkowski for highest out of everyone visible here. Do the math against Brian’s 8.2 open play passes attempted per 90 out of the attacking 3rd, and she’s good for at least 6 completed passes in that third of the field for any given game.

We’ll break down these middle 3rd and attacking 3rd passes further by breaking them down in two different ways – by the direction of the pass (backwards, sideways, or forwards) and by how many were through balls, launch balls, or crosses. That’ll help us better understand what might be behind the differences in passing percentages and how they might differ in the types of passes they attempt.

Open Play Passes by Direction

Below are bar charts now for only Killion and Brian, showing the percentage of their open play pass attempts that went forward, sideways, and backwards, for each third of the field.

Screen Shot 2017-03-12 at 6.23.57 PM

Brian and Killion have virtually the same distribution of open play passes by direction in the middle 3rd, so any differences we can glean from our stats aren’t quite going to be found here. Killion’s open play passing direction in the attacking 3rd, however, is massively different. 71% of her open play passing attempts in the attacking 3rd are going forward, compared to Brian’s 40%. It’s not clear yet, although it might be a smart guess, if these forward pass attempts are what’s bringing down her passing completion percentage. Also recall that this represents about 5.4 and 8.2 open play pass attempts per 90 in the attacking 3rd for Killion and Brian, respectively. Do the math and this means that, even with less attempts in the attacking 3rd, Killion comes out at about 3.8 forward open play pass attempts per 90 compared to Brian’s 3.3. It’s a difference of 1 more forward pass attempt every other game for Killion.

Numbers for attempts by direction are good and give insight into how Brian and Killion are trying to move the ball around but we also have data on passing completion percentages. Below are bar charts breaking down open play pass attempts by direction in the middle 3rd. Each pair of bar charts is for a different direction – backwards, sideways, and forward. The red is incomplete pass attempts, and the orange is complete pass attempts.

Screen Shot 2017-03-12 at 6.39.06 PM.png

Recall that Killion had a couple more pass attempts per 90 in this third of the field, and a significantly higher passing completion percentage, but as far as distribution of direction of passes (the previous chart) they were both very similar. Now Killion and Brian have very similar numbers of pass completed per 90 minutes for backwards and sideways passes, but there’s a significant change for forward passes. Killion is good for almost 3 more completed forward passes in the middle third.

Now let’s look at this same chart, but for the attacking 3rd where there were big differences in the distribution of passes by direction and where Brian had a significantly higher passing completion percentage.

Screen Shot 2017-03-12 at 6.48.31 PM.png

The differences in completed passes are barely above 1, but they do add up, especially considering the total number of pass attempts in this third of the field for both players are in the single digits. So that difference of 0.9 more forward pass incompletions per 90 isn’t massive, but it is chipping away at Killion’s passing completion percentage.

At this point it’s worth noting that the past few charts mean different things depending on how much a “forward pass completion,” a higher “passing completion percentage,” or more “pass attempts per 90” means to you. It intuitively seems to make sense that more of each is good, but with these two players they’ve each had higher numbers in different areas – no one appears to be significantly higher across all stats. Killion in the middle 3rd has a few more forward passes completed, a higher completion percentage, and more open play pass attempts per 90. Brian in the attacking 3rd, however, has slightly more forward passes completed, a higher completion percentage, and more open play pass attempts per 90. If you’re going to get into a discussion about which midfielder is “better” based on these stats, you also need to talk about what you expect out of a defensive midfielder. How good to you expect them to be at passing in the midfield, and – assuming attacking duties aren’t their primary responsibilities – how good do they have to be in the attacking 3rd to make up for a difference compared to someone else in the middle 3rd?

And then there’s the question of how much passing numbers should be adjusted given a team’s players, formation, tactics, and overall performance. If Killion’s passing numbers in the middle 3rd on the face of it are good enough, is there something about the way Brian’s team, the Houston Dash, plays and performs that may forgive lower numbers? The same goes for the attacking 3rd – Brian’s numbers look better, but is there something about Killion’s team, Sky Blue FC, that when taken into consideration makes her a more valuable player than Brian in the attacking 3rd? And, as far as this project is concerned, how much of this extra information is in all the data we’ve already tracked and can thus analyze ourselves?

Some of this additional information is likely sitting in all the match spreadsheets that have been logged for this WoSo Stats project – there’s the potential for further insights if we could get data on passing networks, on situations such as when a team is trailing, on matchups based on the type of players and teams a player is going up against, and likely much more.

For now, let’s look at two more types of passing data. We’ll look at completed passes that go across different thirds of the field, and special types of passes – launch balls, through balls, and crosses in the middle 3rd and attacking 3rd.

Passing Range

The chart below shows the top players by open play passes attempted per 90, with passes completed from the middle 3rd into different thirds of the field (and within the middle third) and with passes completed from the attacking 3rd back into the middle 3rd and within that attacking 3rd. We only have data for completed passes because sometimes it’s not reliably possible to figure out where an incomplete pass was trying to go – such as when it’s blocked right in front of a player trying to pass the ball and it’s not clear just how far down the field the ball was supposed to go.

Screen Shot 2017-03-12 at 7.32.28 PM

Killion overall is completing more passes within and out of the midfield, close to 5 more. The great majority of those are passes that stay within the middle 3rd, and the same is true for Brian. Brian has a few more passes completed within the attacking 3rd. Overall, there doesn’t appear to be a whole lot here to differentiate the two. They’re both obviously distinct from a lot of other players visible here, but it looks like all we can tell from this is that Killion completes more passes per 90 minutes within the middle 3rd than Brian.

Through Balls, Launch Balls, and Crosses

Finally, a look at through balls and launch balls out of the middle 3rd, and through balls and crosses out of the attacking 3rd. Numbers for both players here per 90 minutes end up being small. In the red is incomplete open play pass attempts, and in the orange is complete open play pass attempts.


Screen Shot 2017-03-12 at 7.52.30 PM

Screen Shot 2017-03-12 at 7.52.37 PM

Killion in the middle 3rd appears better at launching the ball forward and completing a through pass, with more completions per 90 and a higher completion percentage for each type of pass.

There’s less to see in the attacking 3rd for either player. Killion and Brian barely complete any through balls from the attacking 3rd, likely because by the time they’re in the attacking 3rd from deep in the midfield most of the opposing team’s defense is already well situated in front of the goal. Killion attempts a negligible amount of crosses, and Brian completes about one cross every other game.

Next steps

These two players were an interesting case study because of how similar they are in playing style and how good they are. I had to explore quite a bit of stats as on the face of it they were quite similar with regards to passing attempts and completion percentage, even when broken down by thirds of the field.

In the future, I’d like to do this with other NWSL players who are also considered defensive midfielders – players like Buczkowski and Winters, and others – to see just how alike everyone who plays this type of midfielder role really is. I touched on this briefly, but something like a passing network visualized, showing just who is getting all these passes, could also shed light on not just where players like Killion and Brian distribute the ball, but who they’re passing it to. Are they passing it off to mostly defenders, wingers, attacking midfielders, or straight to the forwards? There’s also curious cases where each player has lined up not quite in the defensive midfielder role but maybe somewhere further up the midfield or outside the wing – it could be possible to account for those matches. And I haven’t even added any stats related to defending, which is a whole ‘nother aspect of being a defensive midfielder that is arguably just as important as how well they pass the ball.

This is all beyond the scope of this blog post, and I hope to revisit another time. Or feel free to go after it yourself, as the data is all there in the WoSo Stats GitHub repo. For now, I hope you’ve enjoyed a look at how the data we’ve logged can dig into the differences – and similarities – between two very good players who, with very few goals and assists, don’t show up prominently on traditional stats sheets based on goals and assists but, with the stats we’ve got, show up as vital parts of the midfield.

One last thing, and one last time, the WoSo Stats project needs your help! If you’re interested in logging data for matches , read more here and email me at wosostats.team@gmail.com or send me a DM at @WoSoStats on Twitter. All the data logged with be publicly available on the WoSo Stats Github repo.