
We have all 21 of the Portland Thorns’ 2016 matches logged in match spreadsheets like these, which when they’ve got location data I’ve combed through for some valuable location data. I wanted to see how much more passing data I could get out of these match spreadsheets, even without any location data, which only a few of our matches have. Below is a quick look at the numbers for a sort of “passing network”, but without the graphics and lines and instead with just tables and some useful formatting.
The R code I created to generate a table of shared passes and a table of shared minutes is here on the WoSo Stats GitHub repo. There are comments in the code that are hopefully enough to explain how it works but I’ll delve into that in greater detail in a future blog post. For now, let’s at that data for the Portland Thorns to get a better look at how the ball was being passed around.
The Excel spreadsheet shown below, based on tables you can create from the R code mentioned above, can be downloaded here from the WoSo Stats GitHub repo (click on the “Download” button).
I’m just going to briefly go over what we see when use some Excel formulas and conditional formatting, and what it can quickly tell us about how the Thorns were passing around the ball.
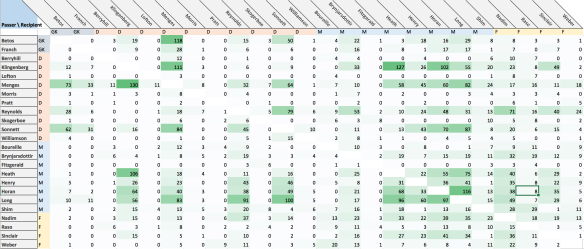
Here’s the first sheet of the Excel workbook, and there’s a few important things to understand that will be true for the following sheets as well.
First of all, the rows are the players passing the ball, and the columns are the players receiving a completed pass. So, let’s look at the bottom-left cell.”Weber” is the row, so she’s the player passing the ball, and “Betos” is the column, so she’s the player receiving the pass; therefore, that cell represents the number of passes that Weber completed to Betos during the entire 2016 season. So, just one.
Second, each cell only represents completed passes. This is extremely important, because we’re missing out on data about how many times a player was actually targeted by another teammate. This data is missing because, well, it can get extremely hard, if not outright impossible, to determine both from looking at the match spreadsheet and even during a match where a missed/blocked/cleared/intercepted pass was supposed to go. Maybe in the future we, or someone else, can go back through all these matches or future matches and figure out how to do that, but for now we’re going to have to go without that. But at the very least understand that these passing numbers only represent completed passes. So, remember that value of 1 that was where the “Weber” row meets the “Betos” column? For all we know, maybe Weber tried passing the ball back to Betos another 10 times and they were missed (probably not, because forwards usually aren’t passing the ball back to their goalie that much, but you get the idea).
Finally, the darker the green, the higher the value of the cell, just in case it isn’t obvious. The whiter the cell, the closer to zero it is. The darker the cell, the closer to the highest value it is.
Okay, now that we’ve got all that out of the way, what’s going on here? There are some extremely dark pockets in this spreadsheet, but they’re not taking into account the fact that some players were on the field together way more than other pairings. Take Amandine Henry, for example – finished the season with 48.4 passes attempted per 90 minutes and 38.3 passes completed per 90 minutes, but her row and column of shared passes is way lighter than other Thorns players simply because they played more minutes and had more time to pass to each other.
We need another table that has the number of minutes a player shared with each teammate, which is below. Writing up the code to generate this was a pain in the ass, so please admire it just for a few seconds.

This table is diagonally symmetric and, for the purposes of this analysis, will mainly be used to calculate the per 90 passing numbers below.

You may have noticed the following players are missing: Berryhill, Lofton, Pratt, Skogerboe, Williamson, and Fitzgerald. This is because for this spreadsheet I hid the columns for players who never were on the field with any teammates for 270 or more minutes. This is to exclude any extremely high passing per 90 numbers that may show up merely because a few passes were exchanged during very limited minutes.
So, now we’re looking at the, for lack of a better term, the “passes completed by the row player to the column player per 90 minutes.” Remember that “Weber to Betos” cell we were looking at, the one in the bottom left? Now it reads as 0.13 passes completed by Weber to Betos every 90 minutes.
I also added each players overall passing completion percentages for the season at the end of each row and column, and the black lines are meant to block out different position players. Finally, the grey boxes are values that had less than 270 minutes. For example, look back to Weber – she was on the field with Betos for at least 270 minutes, so that 0.13 value appears, but she was only on the field with Franch for 91 minutes, so that cell value gets greyed out.
There’s a lot to dig into here, but one thing I like looking at is how defenders move the ball to the midfielders, how midfielders move the ball to the forwards, and how the goalkeepers and defenders try to get straight to the forwards. By looking at the defender rows, it looks like Klingenberg-to-Heath and Klingenberg-to-Horan are by far the most fruitful midfielder-to-defender passing relationships. The only other defender-to-midfielder to relationship that happens as much is Sonnett-to-Henry, and keep in mind Henry only played half the season.
In the midfielder rows, where they meet the forward columns, there’s less darker colors because it’s just harder to pass the ball to the forwards, so that section of the table is just naturally going to be a lighter shade most of the time. One stat that stands out to me is how the high number of passes Shim completed to Raso, 5.08, higher than any other midfielder-to-forward combo, especially considering they were only on the field together for 536 minutes.
Now, let’s look at this table with the highlighting done a little differently. Below is the same numbers as above, but with each row highlighted individually.

Look at the Betos row, for starters. The higher value in that row is the 7.19 completed passes to Menges, so that’s going to be the darkest cell in the row. Meanwhile, the lowest value of 0.13 completed passes to Weber is the lowest, whitest cell. A few rows down, Sonnet’s highest value of 5.62 completed passes to Betos is the darkest cell, while her 0.85 completed passes to Heath is the lowest.
This table will probably make most sense if you look at the columns and look for which players have a high number of very dark cells. Menges appears to have been a very frequent passing target for almost every defender. Heath and Henry had a relatively high number of completed passes from defender, midfielders, and forwards. Nadim had a high number of completed passes from midfielders and other forwards, and Sinclair looks like she was deeper down the field and had a relatively high number of completed passes from midfielders and defenders.
Finally, let’s look at this highlighted flipped around. Now, each column’s highest values are highlighted.

Take a quick look at the rows and see which players were more likely to be the origin of a completed pass. Klingenberg, across the board from goalkeepers all the way up to forwards, appears to have been the origin of a relatively high number of completed passes for many teammates. Farther down the table, Allie Long and Amandine Henry were the origin for a great deal of completed passes for several defenders, midfielders and forwards.
There’s more to dig into here, and especially when we compare these raw numbers to another team’s passing network. There are three other ones I’ve created for the Seattle Reign, Western New York Flash, and the Houston Dash that can be found here on the WoSo Stats GitHub repo. In a later blog posts, I’ll look compare these to each other to see just how wildly different a team can pass the ball around. For now, I hope you’ve enjoyed seeing the rich data we can glean into passing relationships from the data we’ve got.

Pingback: Passing networks for the Seattle Reign’s’ 2016 season | WoSo Stats